
Education Performance Indicators (EPIs) are a core part of TEC compliance and performance monitoring. SELMA provides a built-in EPI Report designed to help providers visualise, track, and export these indicators in line with the TEC’s official methodology.
The EPI Report is a valuable tool, which allows you to track live measurements of all of your data, including but not limited to EFTS, Completion and Qualification Rates and Students and Enrolments.
We highly recommend checking your progress regularly throughout the year, and especially before SDR submissions.
In this section:
Running the EPI Report
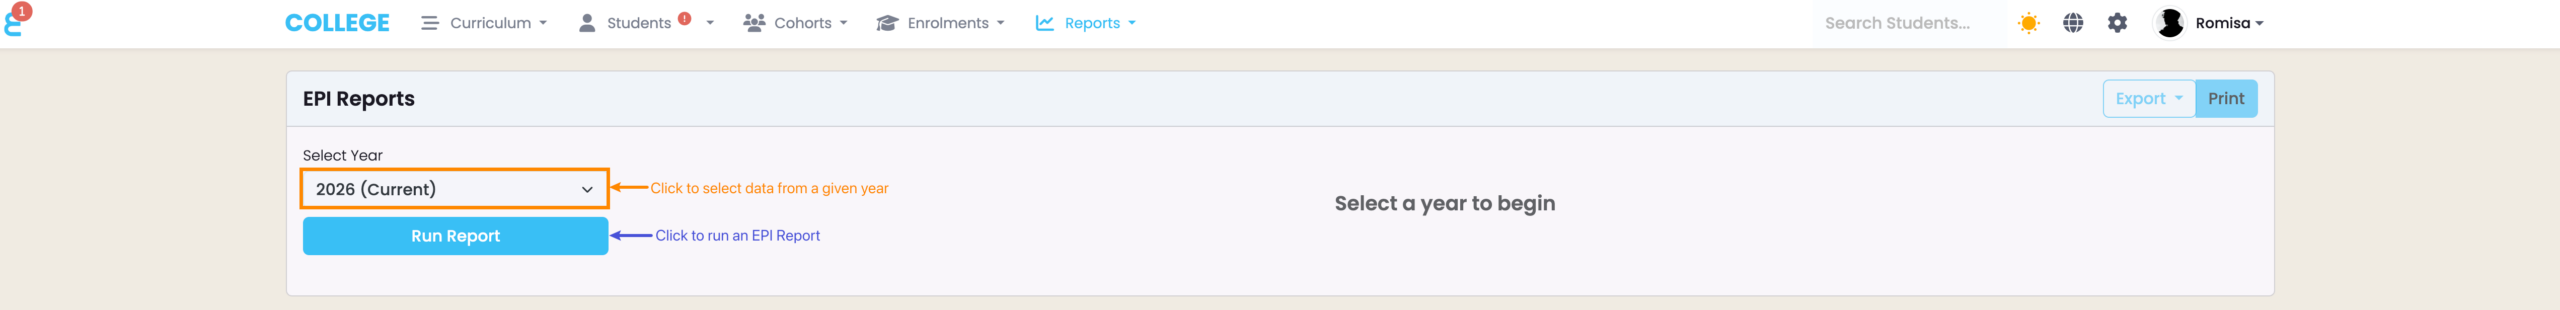
Navigate from Reports > SDR Report and select a year for reporting (Figures 1i-ii.).
Note:
- The EPI Report contains live, dynamic data. So, any current updates to data reported in the previous year affects the results of the EPI report of that previous year.
- E.g. If you have reported extended Enrolments in December 2024, and those Enrolments are completed February 2025, the 2024 EPI report will now reflect results after those changes.
Figure 1i. Access your provider’s EPI Report by navigating from “Reports” in the top navigation bar (red) to “EPI Report” (purple).

Figure 1ii. Select a year (orange) to run an EPI report against.
Navigating the EPI Report
There are three key tabs in the EPI Report: “Report View”, “Raw Data” and “EFTS by Student”.
There is a filter panel on the left of each of the tab displays, where users can refine the report results by general categories, such as year, gender, intake and funding source, and specific characteristics like Māori or Pasifika. This level of granularity supports internal QA reviews, TEC submissions, and governance reporting.
Note: Disability Status and Low Prior Achievement have been added as filters to allow for filtering where targeted funding from TEC may apply.
Read on to see what you should expect within each tab.
Report View Tab
The “Report View” tab gives an overview of your provider’s performance metrics, and visualises them in the form of pie charts and tables (Figure 2.).
Key Metrics and Measurements
- Students: Total unique learners with valid enrolments in the selected year.
- Enrolments: Total programme enrolments for the year.
- Completion Rate (EFTS-weighted Course Completion): This is the EFTS-weighted completion rate for all courses, as outlined in Section 4 of the TEC EPI Guidelines. It reflects how successfully students completed the courses they enrolled in.
- Possible Completion: Reflects the rate at which courses currently to be completed could be successfully completed.
- Qualification Rate (EFTS-weighted Qualification Completion): As detailed in Appendix 6 of the TEC EPI Guidelines, this rate considers the EFTS value of qualifications completed compared to the total EFTS value of all qualification enrolments.
- Total EFTS: The sum of all EFTS values relevant for funding in the selected reporting period.
Figure 2. The “Report View” tab features counts and measurements across different elements, and includes filtering options. Click a pie slice to quickly filter by category (see red text).

Raw Data Tab
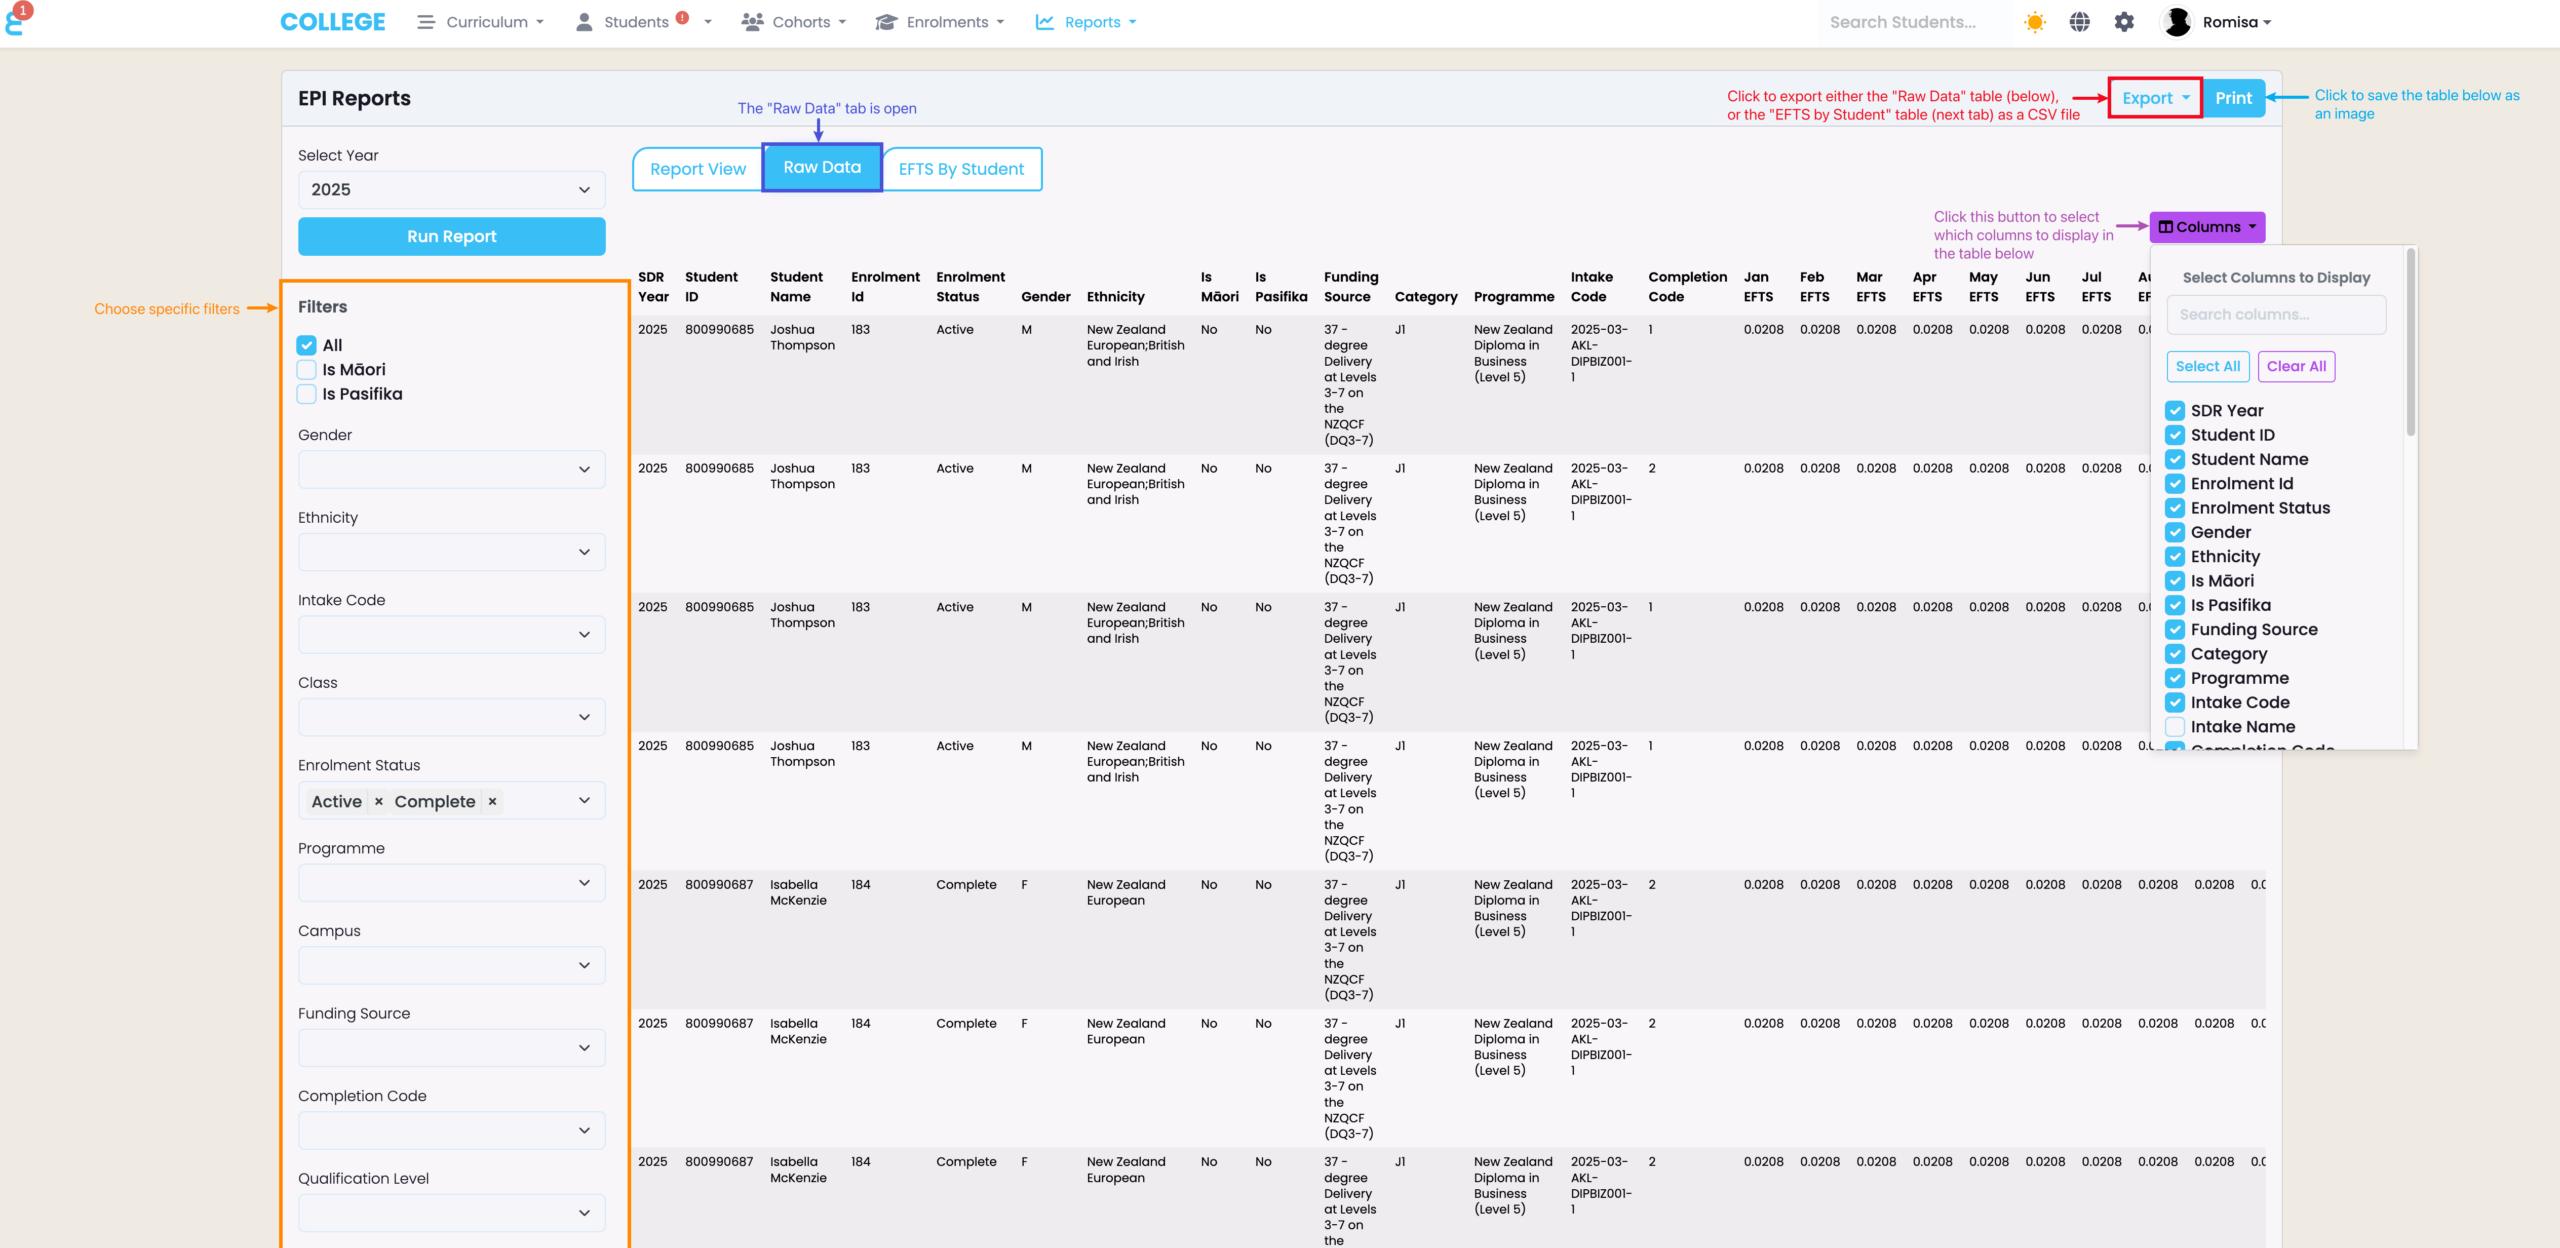
The “Raw Data” tab displays Course information as per your filters. You can also export the table as a CSV or PDF image, if you wish (Figure 3.).
Figure 3. Click the purple button to select which columns to include in the “Raw Data” table, and use the left panel to filter for specific details (orange). Click the “Export” button to download a CSV file of the table (red), or click the “Print” button to save it as an image (blue).
EFTS by Student Tab
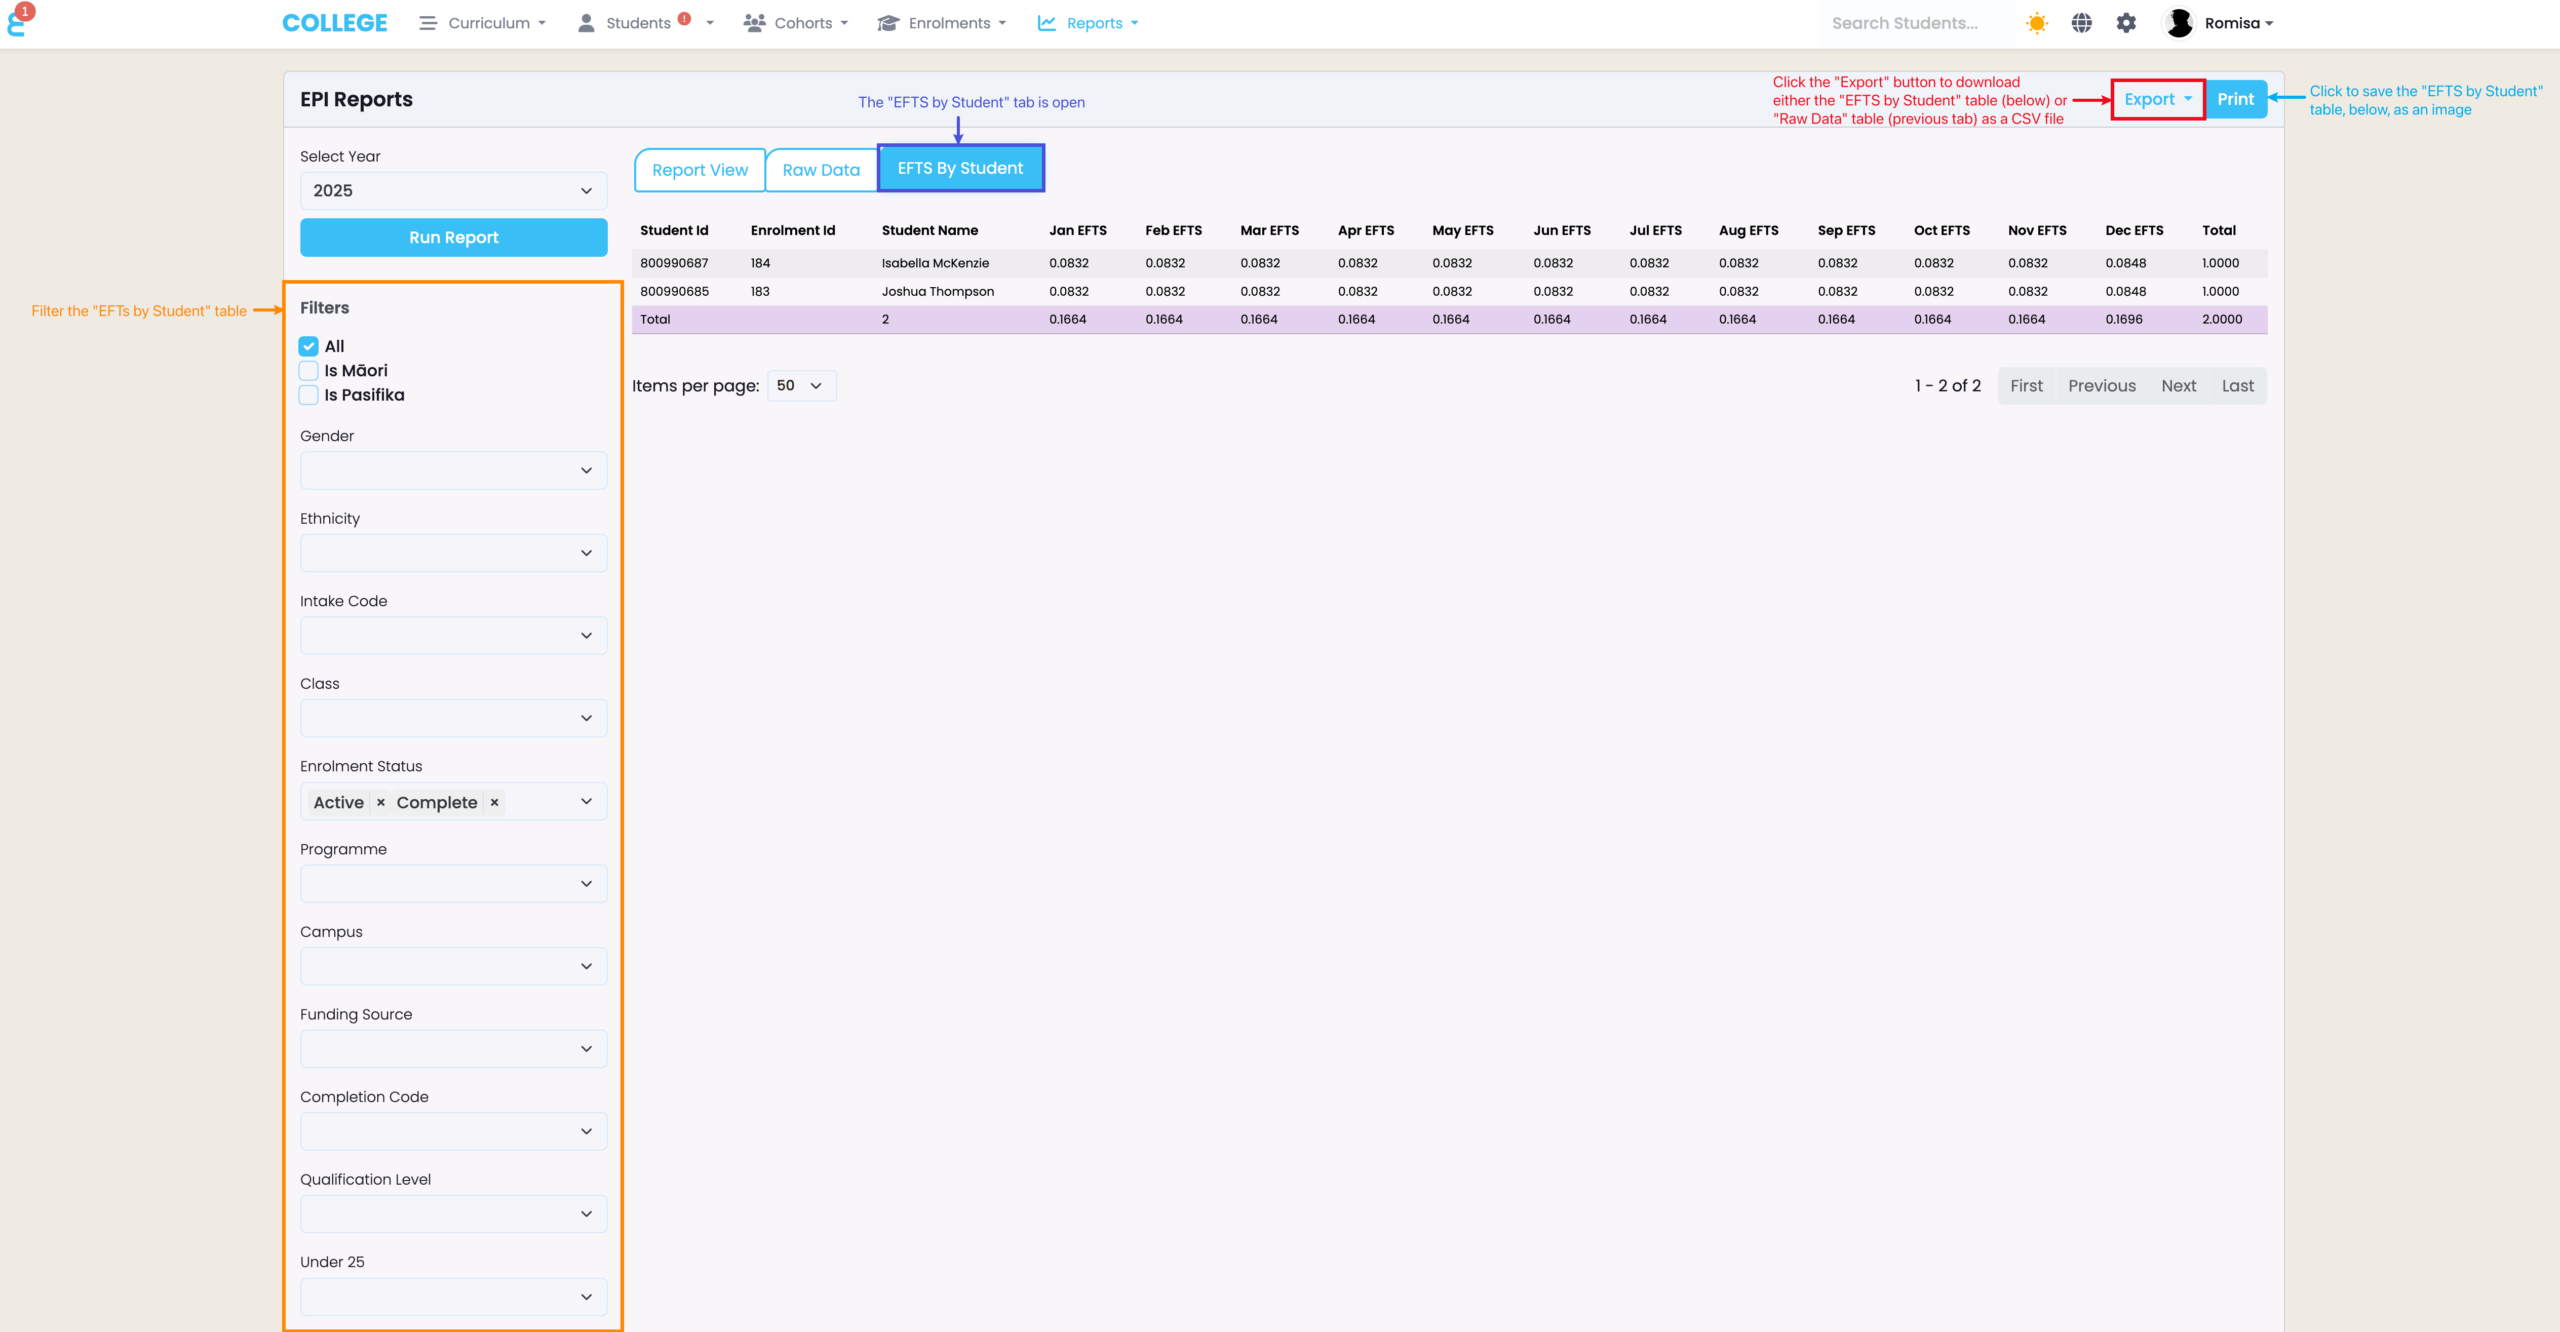
The “EFTS by Student” tab displays a table of monthly EFTS values by Student Enrolment, which you can filter like previous tabs, and download as a CSV or PDF image (Figure 4.).
Figure 4. Use the left panel to filter for specific details (orange). Click the “Export” button to download a CSV file of the table (red), or click the “Print” button to save it as a PDF image (blue).
TEC Guide
Learn more about these EPIs by referring to the official document published by the (TEC): EPI Guidelines and Methodology