
Here’s what you’ll find in this article:
- Report Builder Overview
- Accessing Report Builder
- Selecting a Base Entity
- Building Your Report
- Running & Exporting Reports
- Subscribing to a Report
- Report Limits & Best Practices
- Need Something More Complex?
Report Builder Overwiew
The Report Builder lets you create your own ad‑hoc reports inside SELMA SIS—no coding required. Pick the fields you want, decide which ones should behave as filters, then run or schedule the report in just a few clicks.
Use Report Builder for straightforward data extraction such as:
- Lists of enrolments with programme names and dates
- Basic student directories (name, email, phone)
- Simple intake or class snapshots
If your reporting needs involve complex calculations or data drawn from many tables, see Grid Reports instead.
Accessing Report Builder
- From the top navigation bar, choose Reports → Report Builder.
- The Report Builder home page lists every report you’ve already created.
- To create something new, click the New button in the upper‑right corner.

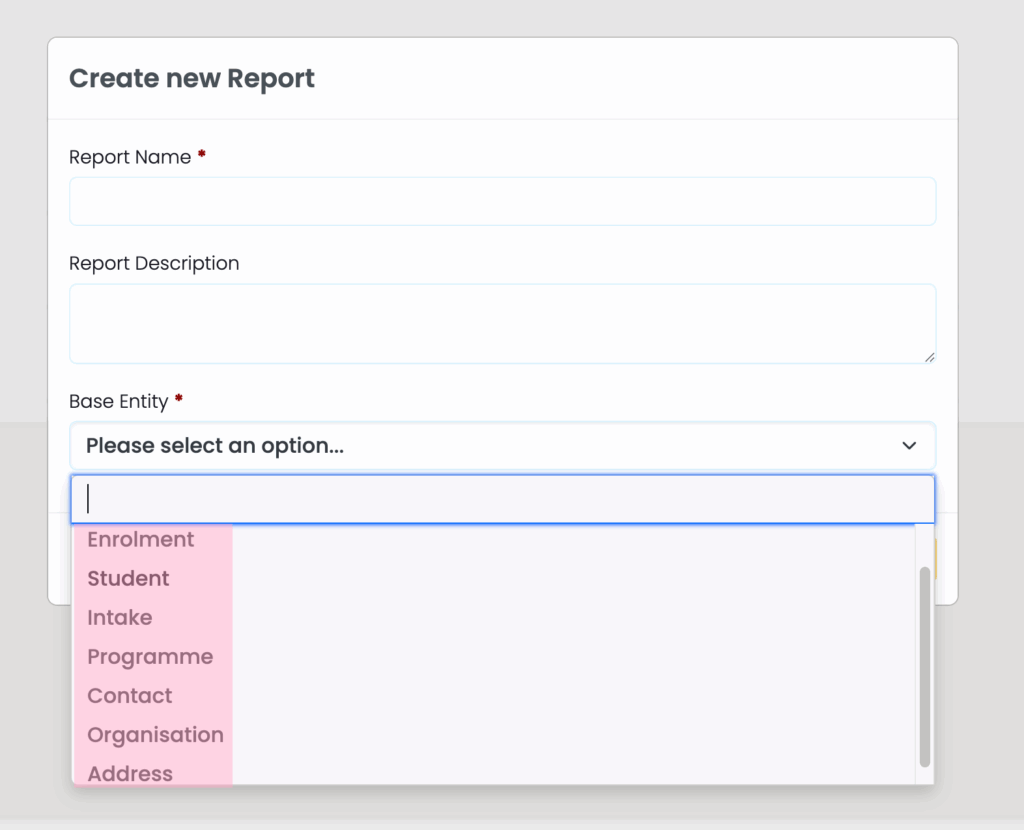
Selecting a Base Entity
Every report starts with a Base Entity—the primary table the report pulls data from. Choose one of the following:
- Enrolment
- Student
- Intake
- Programme
- Contact
- Organisation
- Address
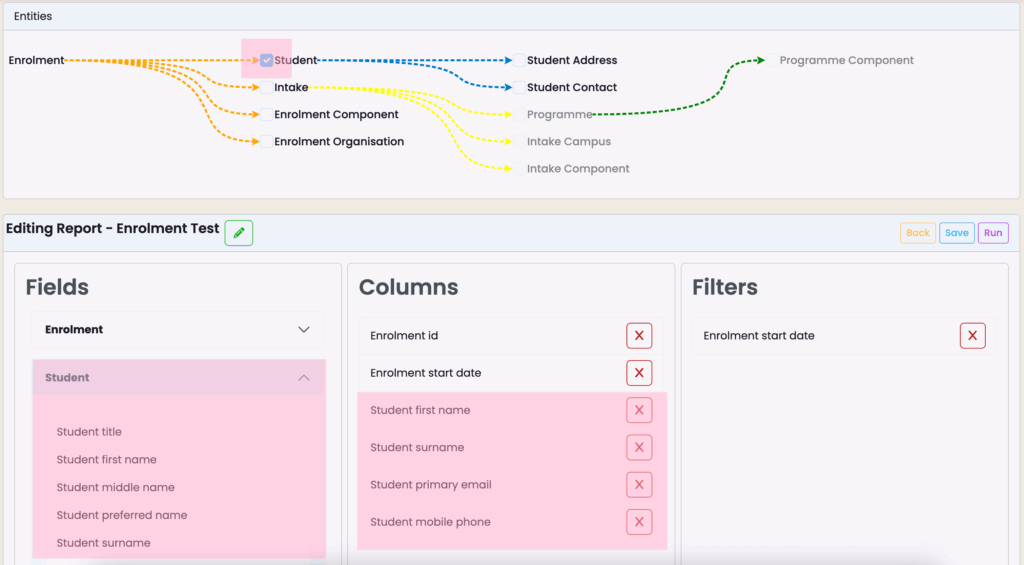
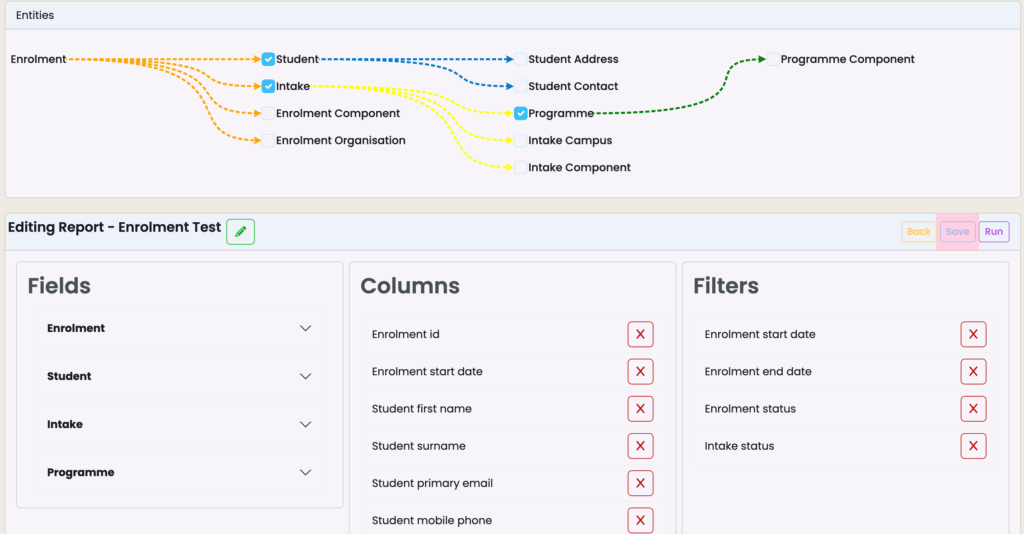
Your choice determines the initial set of available fields and the relationship map displayed at the top of the builder. You can still traverse to related objects (e.g. start with Enrolment and add fields from Student), but pick the entity that best represents the main focus of your report.
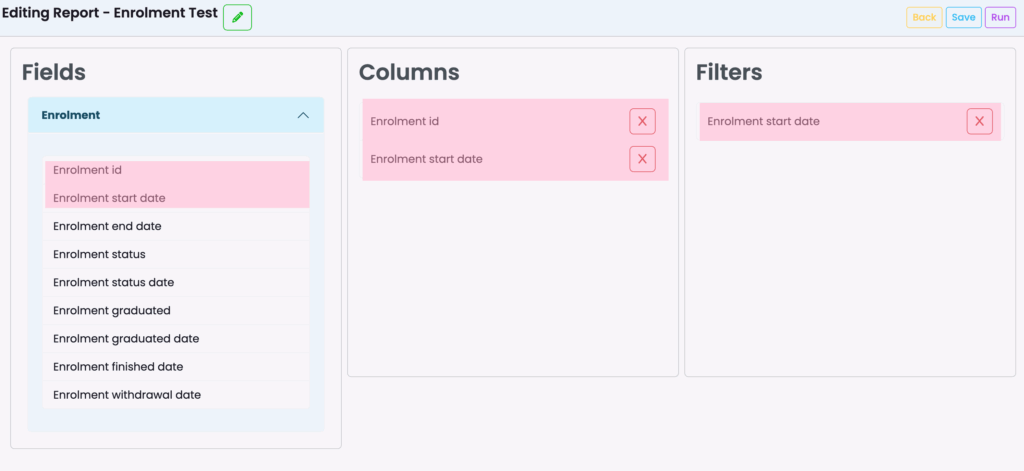
Building Your Report
- Drag & drop fields
- Columns – data that will appear in the output.
- Filters – criteria you’ll set each time you run the report (date ranges, statuses, etc.).
- The same field can live in both areas if you want to display and filter on it.
- Follow the relationship flow shown at the top to reveal fields from related objects. There’s no hard limit on the number of columns, filters, or linked objects—add as many as you need.
- Click Save when you’re happy with the layout.

Drag and drop to set your columns and filters:
On the top of the report creation, you will see the flow of how the entity works:
Click Save when you’re happy with the layout:
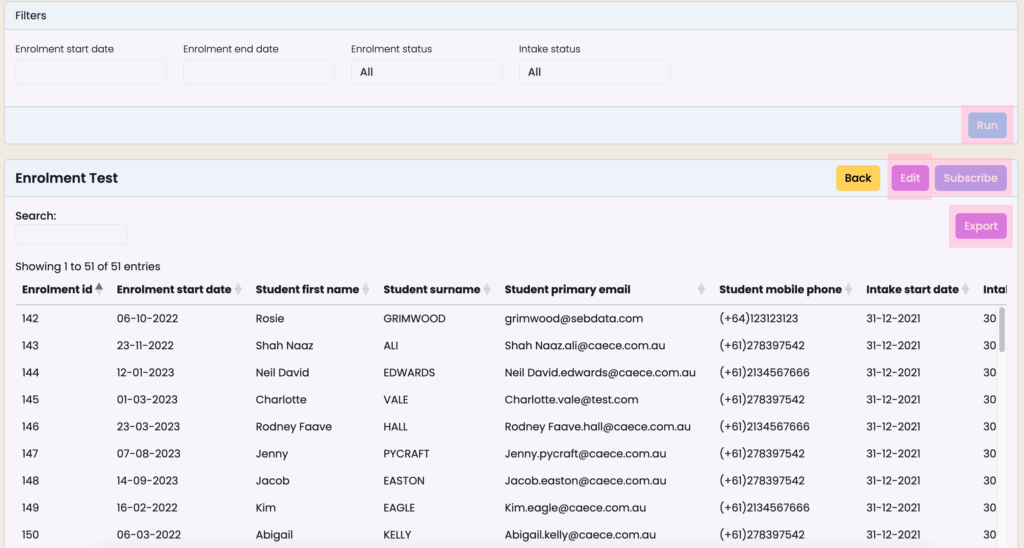
Running & Exporting Reports
- Click Run to open the report. Any filters you added will appear at the top of the screen—fill them in or leave them blank to return all data.
- Results display on‑screen (max 2,000 rows). Need everything? Click Export and the full file will be emailed to you as a CSV attachment.
- Use Edit at any time to return to the builder and tweak your columns or filters.
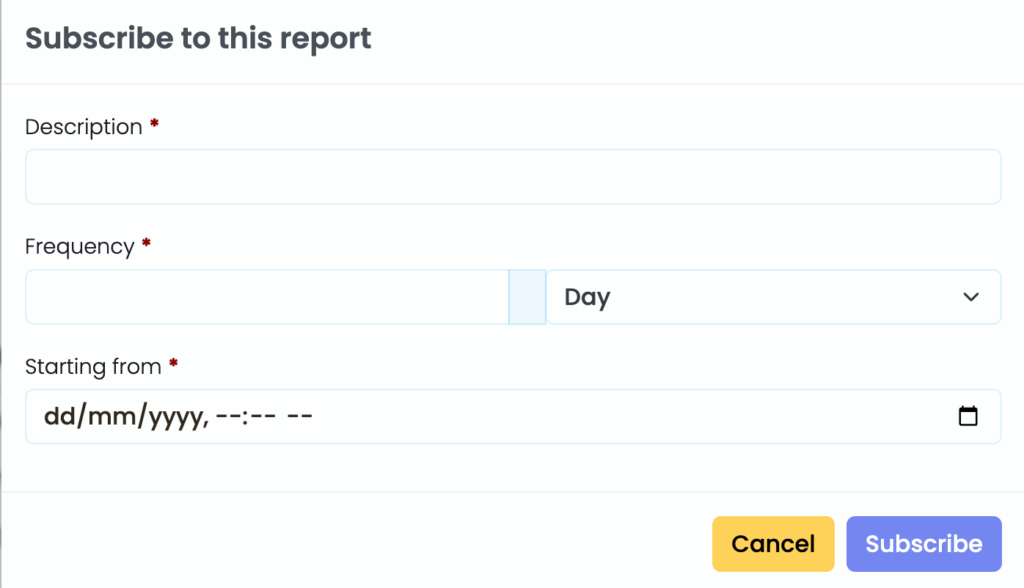
Subscribing to a Report
Automate delivery so you never forget to pull the numbers:
- Open the report and click Subscribe.
- Give the subscription a name, pick a frequency (daily, weekly, monthly, yearly), and set the start date/time.
- Save—SELMA will email the CSV on the schedule you chose.
You can create unlimited subscriptions and modify or delete them later from My Profile → Subscriptions.
Report Limits & Best Practices
| Topic | Details |
|---|---|
| Row limit (on‑screen) | 2,000 rows. Use Export for the full data set. |
| Performance | More columns & complex relationships = slower run time. Start simple and add fields incrementally. |
| Naming convention | Prefix reports with an area or team (e.g. Sales – Monthly Intakes) so others can find them easily. |
| Security | Report Builder respects role‑based access control. Users see only data they have permission to view. |
Need Something More Complex?
If you require advanced calculations, multi‑level joins, or highly customised formatting, a Grid Report is the better option. Lodge a request with the Support Desk and include as much detail as possible; simple Grid Reports are often free, while complex builds may incur a development fee.